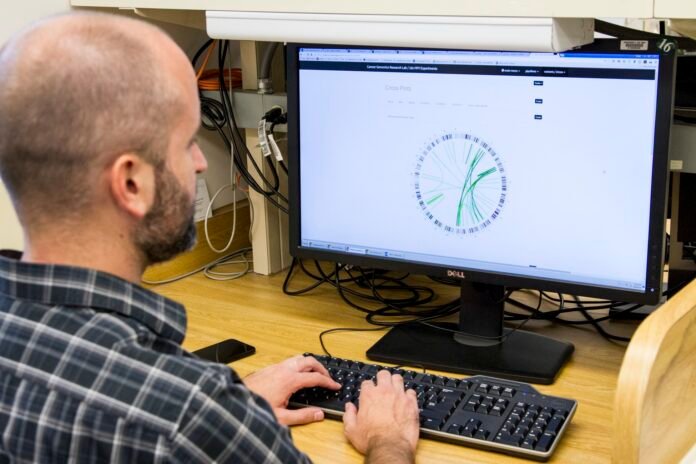
Statistical data needs analysis and to do extensive and quality statistical analysis you will need statistical analysis tools. Dealing with big data, which is quite demanding, will require you to up your game and use better software, and you are probably wondering, which is the best software for you in comparison between SPSS and GraphPad. Well, of course, there is other software out there but how do these two compare and which one is worth your time, effort and money? Our SPSS data analysis help experts take us through the difference between SPSS and Graphpad prism.
SPSS
SPSS is an abbreviation derived from ‘statistical package for socal sciences’. It has a couple of features that are outstanding and that give it an edge in the market. In a bid to make a proper comparison let’s explore each of them in depth.
User-friendly interface
This boils down to the easy-to-use interactive user interface that comes in handy whenever you need to use a variety of tools.
Integrates with open sources
This software allows for syntax enhancement by allowing integration with third-party properties such as Python, R or any other.
Quite expensive
Talking of cost, SPSS offers a range of prices that gradually unlock various features. However, compared to any other software it is quite expensive
Able to handle large amounts of data
As a researcher or professional, dealing with large amounts of data, this will work in your favour. SPSS has the proper capacity to handle massive amounts of data and still operate seamlessly.
Quick and easy to learn
SPSS is quite similar to excel and most people have found it easy to use even with the least amount of technical expertise in statistical software operations.
GraphPad
No extra coding required
With this software, all you need to do is feed it with data and watch your results being generated. You don’t need to be a coding guru to handle statistical analysis using graph pad prism
Visual aids
Graphical representation of data is a necessity as far as statistics is concerned and to get the best out of the software of your choice you need to have an array of tools that allow you to manipulate your graphs in a way that best suits your data. Graphpad has proved to have impeccable visual aid tools that get the job done.
Assisted analysis
The one thing better than having proper software is getting software that you can rely on and with the help of AI, one that gets some work done for you. With Graphpad, all you need to do is click on an equation and you get a graph that ‘fits the curve, displays a table of results and function parameters, draws the curve on the graph, and interpolates unknown values.’
Relatively cheaper
I do believe that cost is an important issue and getting proper returns from your cash should be almost guaranteed. With all the features and tools, Graphpad is relatively cheaper when compared to SPSS. It is also quite accommodative and allows both students and professionals to make use of it. At expert writing help we have a team of statisticians who are specializing in graph pad for statistical analysis.
Takeaway
The technicalities however go deeper and are subject to an individual’s preferences. However, from the reviews and experience gained after interacting with both of them, I would vouch for GraphPad for anyone looking for a proper, reliable statistical analysis software.


